Guide
- Learn fundamentals of stock price patterns
- Learn pattern recognition and pattern recognition data metrics
- Common pattern recognition screener examples
What is stock price pattern
Stock price charts are unique patterns formed by the movement of stock prices on a chart and are the basis of technical analysis. Stock technical analysis seeks to identify stock price movements by constructing pattern models to predict the future direction of stock prices. MarketSmith uses exclusive data analysis techniques to automatically identify seven key patterns from stock price data.
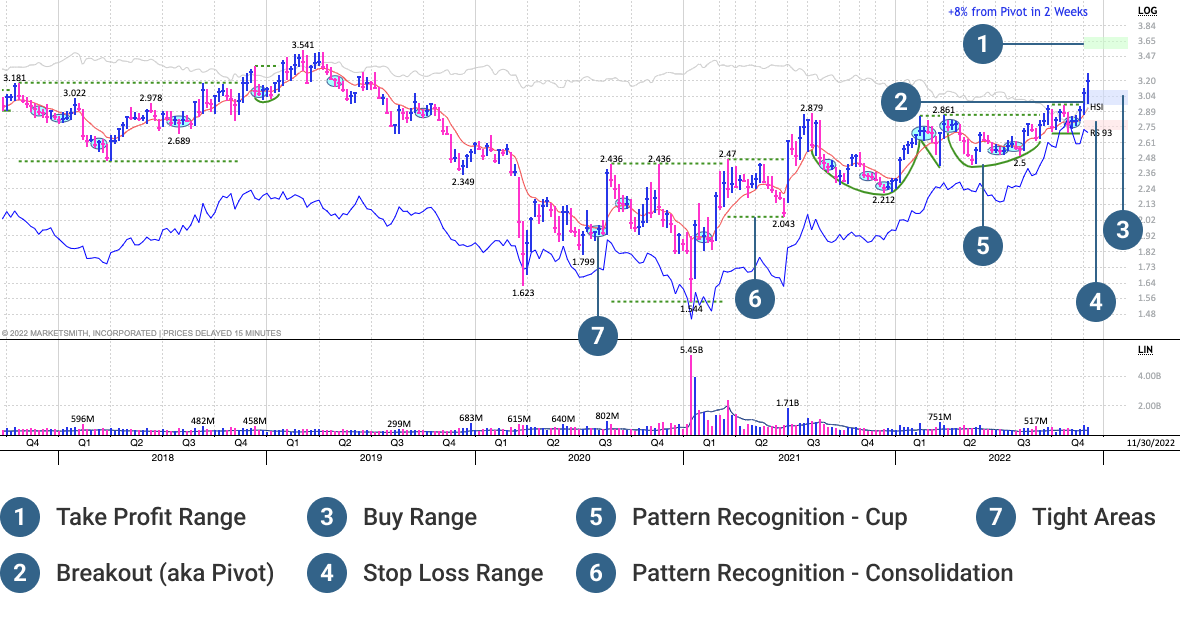
The MarketSmith pattern recognition feature highlights automatically identified stock patterns on the daily and weekly stock price charts. Learning to identify these basic patterns helps you make important investment decisions, especially the graphically labeled best buy and sell zones, which provide important technical information for your investment trade decisions. And showcase several important indicators related to pattern recognition, including Base Number, Base Depth, Pivot Price, and more.
Significance of Stock Patterns
Stock price patterns imply trends in stock price movements characteristic. By analyzing the historical stock price movements, it can be observed that many big winner stocks have these pattern characteristics, and of course there are also patterns that foretell the emergence of a downward trend in the stock.
You may learn stock patterns in many ways, but we recommend this market-proven book on investing - "How to Make Money in Stocks". It was written by our founder, William O'Neil. In this book it introduce above 7 patterns a lot of details. These patterns could be reliable stock price signals, and you can get all of these pattern information provided by MarketSmith Hong Kong, they can be used as an important technical basis for your daily stock research.
Learn Pattern Recognition Data Metrics
1. Base Name - Name of stock pattern type, you can use this data metric in our stock screener to filter stocks with specified patterns you are interested in.
2. Base Stage - Stocks in uptrend may have multiple stock price patterns over a period of time (as long as 1 or 2 years or longer), which are divided by stages according to time sequence and changes in stock price. The significance of the pattern stages is that when the stage is elevated, it means that the stock price has gone up by a certain amount, and subsequently the risk of the pattern increases, and the risk in the 3rd and 4th stage is higher. If stage is maintained, it indicates that the stock price is encountering stronger resistance.
3. Base Number - Most winner stocks will form several patterns during uptrend, each pattern is in a different "stage" of the pattern, and the Base Number is a count of all the patterns during the uptrend.
4. Break out(Pivot) - We call it a Break out or Pivot when stock price rises above the Pivot Price of pattern. See Cup with Handle. From aspect of technical analysis, a breakout means that the stock price will start an uptrend for a period of time. However, there is still a risk of failure after the breakout, so be sure to use it with comprehensive information.
5. Price vs Pivot Price - This is a key indicator that reveals how a stock is performing relative to the Pivot Price, for example, current stock price is 10% above the Pivot Price. The MarketSmith stock screener allows you to quickly check the breakout performance of all stocks in A-shares and Hong Kong markets.
6. Price to Pivot Price - This is another key indicator that reveals whether a stock is about to break out and how far away it is from the Pivot Price. The MarketSmith screener allows you to quickly look for stocks that are about to breakout in A-shares and Hong Kong markets.
7. Date of Tight Areas - The data metric refers to a minimum three-week closing price percentage change rate between -1.5% and 1.5%. Our stock screener allows you to quickly search for all stocks that has at least 1 Tight Area plot in stock chart.
Log in to the MarketSmith web tool or mobile app for more detailed descriptions and instructions on how to use the above indicators.
Common pattern recognition screener examples
Disclaimer: The examples are for software instructional purposes only, MarketSmith Hong Kong makes no commitment that its stock screening methods may result in any gains or losses for real-world stock trading. It should not be construed as an offer, solicitation, or any advice or recommendation to buy or sell securities. Users should use public information wisely and be cautious of market risks! Feel free to contact us directly if you have any questions.
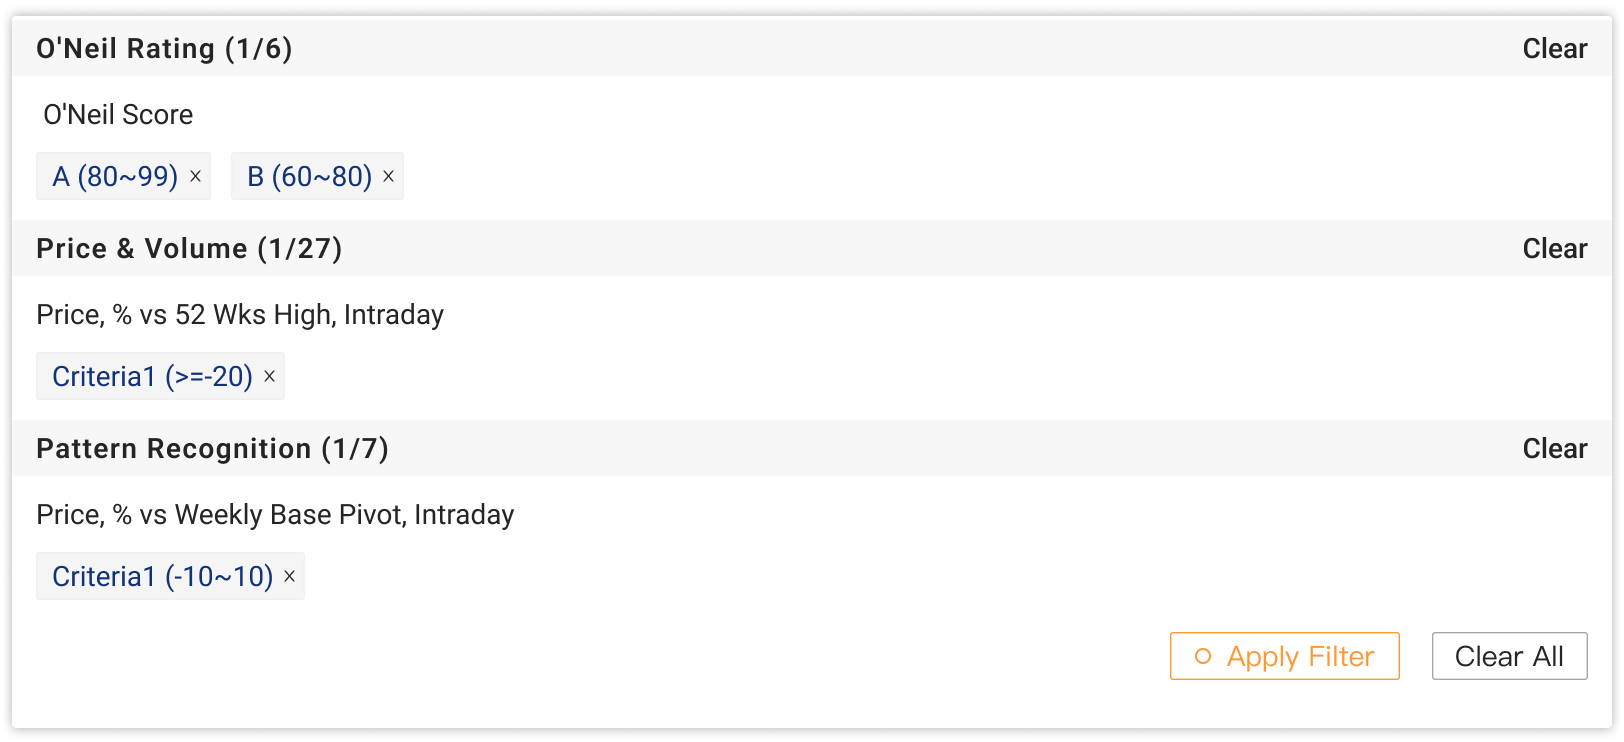
1. Screen for Near Pivot Stocks
Ideas
A stock pattern breakout is a positive technical analysis signal. Screening stocks that have a breakout in the recent past or in the near future is useful to identify market situation, and is also useful to look for winning stocks.
Filter Criteria
Screening for stocks that already break out to pivot price or about to break out in weekly stock charts, and current stock price is not far above or below the Pivot Price, can be achieved by setting following criteria:
- Price, % vs Weekly Pivot Price, Intraday, value is between -10% and 10%. This range of values indicates that the pattern may be in forming, with current price below the Pivot Price but within 10% changes from pivot price, or that the pattern is complete, but the stock price still hovering within 10% changes from Pivot Price.
- O'Neil Score, value is greater than 60. O'Neil Score is a quantitative rating of a stock on a market-wide scale that takes into account both fundamentals and technicals, with a score greater than 60 indicating that the stock's overall analysis outperforms 60% of the stocks in the market.
- Price, % vs 52-Wks High, Intraday, value is greater equal than -20%, meaning that the current price has no more lower 20% compare with the stock's one-year high price. O'Neill believes that it is a more sensible strategy to buy stocks in uptrend, so we only retain stocks whose stock price moves at a relatively high level in recent last 1 year.
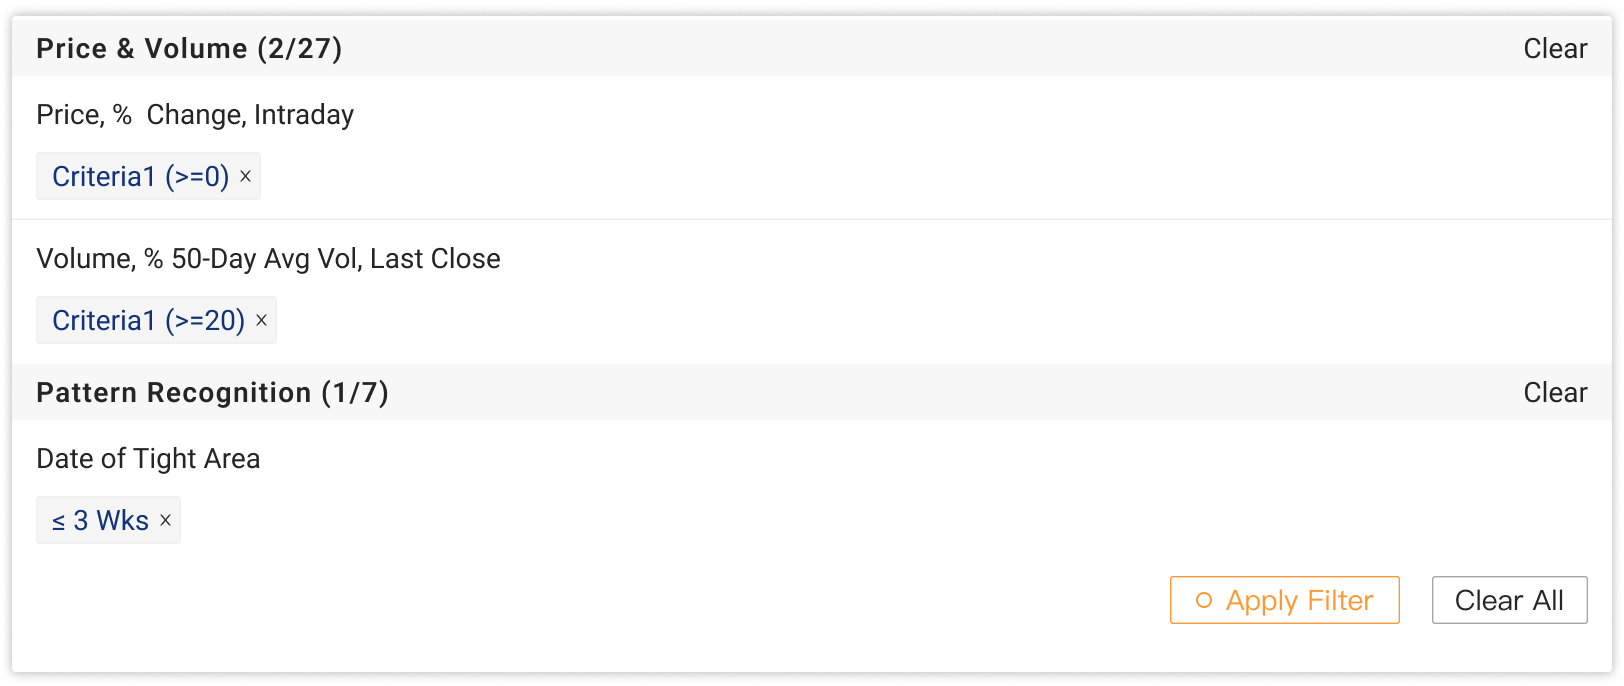
2. Screen for Tight Areas Stocks
Ideas
Tight Areas is defined as a range of 1.5% +/- of the closing price for at least three weeks. MarketSmith's pattern recognition indicates Tight Areas on the weekly chart with a blue oval. A Tight Areas indicates a period of time when the comparison of long and short money are almost equal, which means that the probability of an upward move in the next period, especially if volume amount becomes bigger.
Filter Criteria
- Date of Tight Areas, less than or equal to within 3 weeks. This indicates that a Tight Area has been identified in the last 3 weeks in weekly chart.
- Volume, % vs 50-Day Avg Vol, greater than or equal to 20%. This ratio measures how large the volume increase, and this filter indicates that daily volume above 20% of the 50-day average volume.
- Price, % Change, Intraday, screens for stocks with price up.