Double Bottom
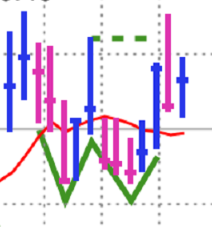
A stock chart pattern identified by MarketSmith founder William J. O’Neil, this pattern looks like the letter W. In almost all cases, the second leg down should undercut the low price of the first to shakeout weak holders of the stock.
A Double Bottom can last from 7 to 65 weeks, with depth ranges from 10% to 50%.
The Pivot, or optimum buy point, for a Double Bottom is equal in price to the top of the middle peak of the W.