Cup With Handle
A stock chart pattern discovered by MarketSmith founder William J. O’Neil, this pattern on a high-low-close bar chart looks like a cup with a handle when the outline of a cup is viewed from the side.
Cup patterns can last from 6 weeks to as long as 65 weeks. The usual percentage correction from the absolute peak to the low point of the price pattern varies from 8 percent to 50 percent.
O’Neil identified this pattern as being one of the most common to show up before stocks went on big runs in his study of the best stocks of all time. The pattern should be proceeded by a prior run-up of 30 percent or more that shows strong demand for the shares. Then the stock will pull back, often correlated to a general market pullback.
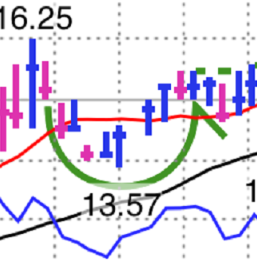
The cup part of the base should be round, more like a “U” than a “V,” which gives the time to shake out weak holders. As the stock recovers to test the old highs, there will be one last bout of selling pressure as people who bought at or near the old high look to get back to even. This forms the Handle portion as the stock drifts slightly lower, preferably on low volume, before it takes off.
The Pivot, or optimum buy point, for a Cup-With-Handle base is when the price passes through the peak price of the handle. This breakout should occur on heavy volume.