Would you trust a doctor who never looked at an X-ray or an MRI? How about a navigator that never looked at a map?
What an X-ray is to a doctor, a price-volume chart is to a stock investor. Price changes are the result of the daily supply and demand in the large auction marketplaces that stock markets represent. MarketSmith founder, William J. O’Neil, was a pioneer in using stock charts to identify the optimal times to buy and sell stocks. The charts in the MarketSmith Hong Kong application reflect his over 50 years of research on what is most important to making profitable investing decisions.
In this post, we will go into detail on how to read our Daily and Weekly price charts and what the different indicators mean and how they can be valuable for your investing.
To start, here is a visual overview of our weekly chart view for the Desktop and Mobile. Below we go into more detail of how to use these indicators.
The two main components to our stock chart are the Price section at the top, and the Volume section below.
In the Price section, the vertical price bars show you the stock’s price range for that day (on a daily chart) or for the week (on a weekly chart). The horizontal slash shows you the stock’s closing price. In general, you would prefer stocks that tend to close at the top of their ranges, a sign of strength.
When a day or week finishes up in price, it is colored in blue. Down days are colored in magenta. You can cross reference each price bar to its volume bar down below. When a stock moves higher in high volume, it is a sign that institutional investors may be accumulating shares. On the other hand, if it starts to move lower on increasing volume, it could be a sign that institutional investors are heading for the exits.
We include two important moving averages on our charts by default, the 50-day moving (10-week on weekly) in red and the 200-day moving average (40-week on weekly) in black. Since institutional investors track these levels closely, they are key support levels for a stock. A powerful stock will tend to bounce off these levels to higher prices.
We also include a 50-day (10-week on weekly) moving average in navy blue next to the volume bars. This is quickly visual indicator if volume for that period is above or below normal. The number next to Vol in the volume area is the Volume rate. That compares the volume for the day or week against its average volume. A +34% rate would mean the volume was 34% above average for the most recent volume node.
In blue beneath the price bars is a Relative Strength line. This plots the stock’s performance to the larger market as represented by the Hang Seng index. If the stock is outperforming the Hang Seng, its relative strength line will move higher. If it is underperforming, the line will drop. The number next to the RS line is our RS Rating which ranks all stocks on 12-month price performance on a 1 to 99 scale, with 99 being the best performing stocks. We prefer to concentrate on stocks with Relative Strength Ratings of 80 or higher.
The percentage following the 52-week high value in the price column indicates the current stock price relative to its 52-week high. Generally, we prefer stocks trading within ±15% of their 52-week highs.
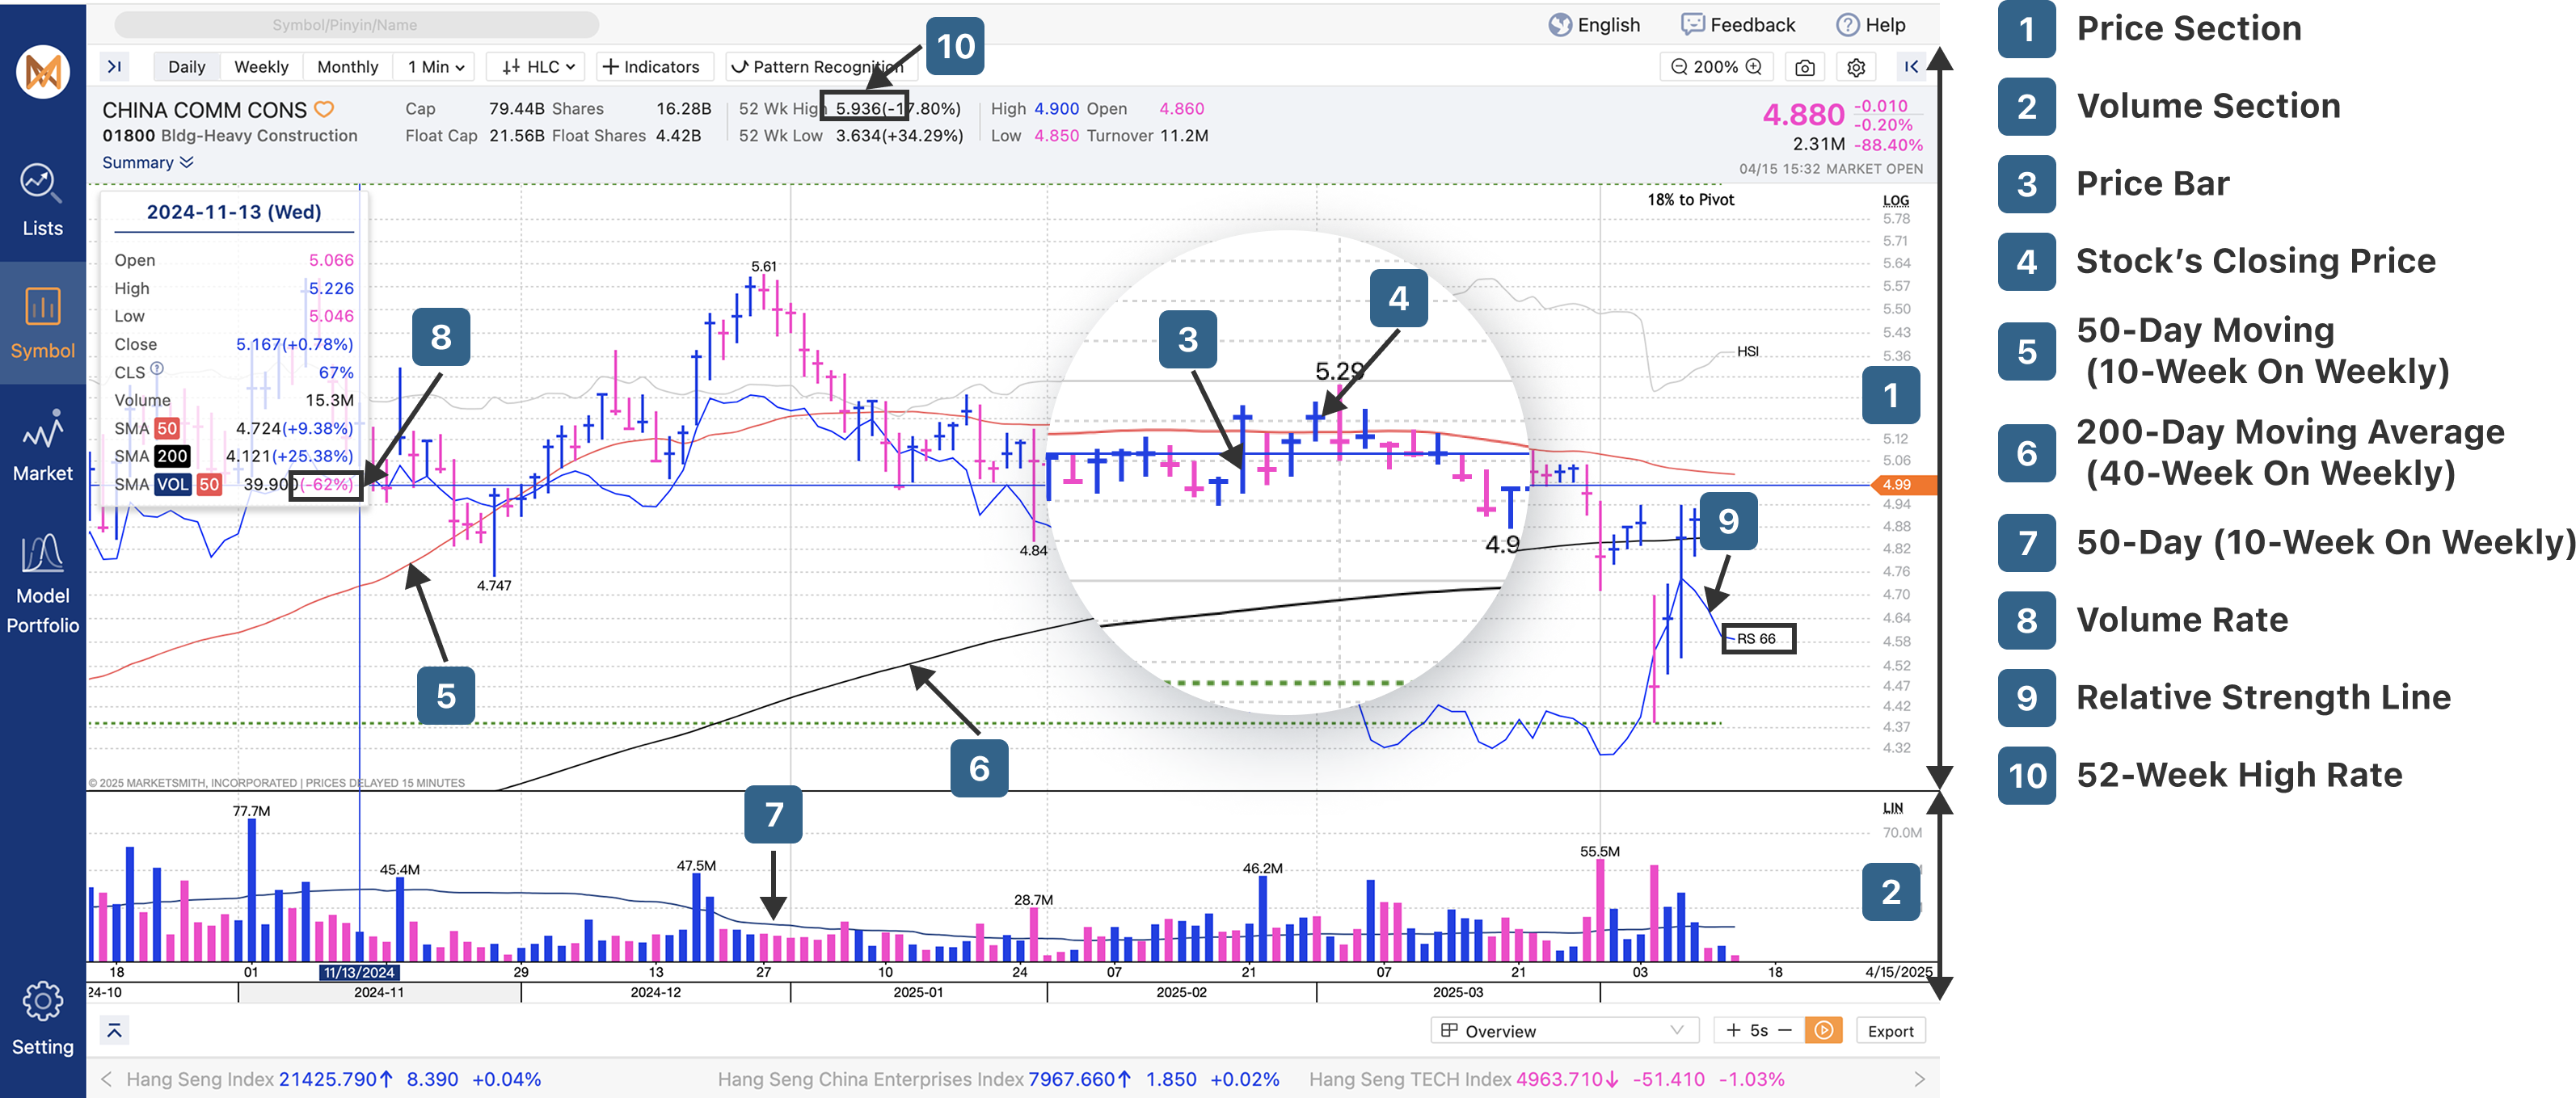
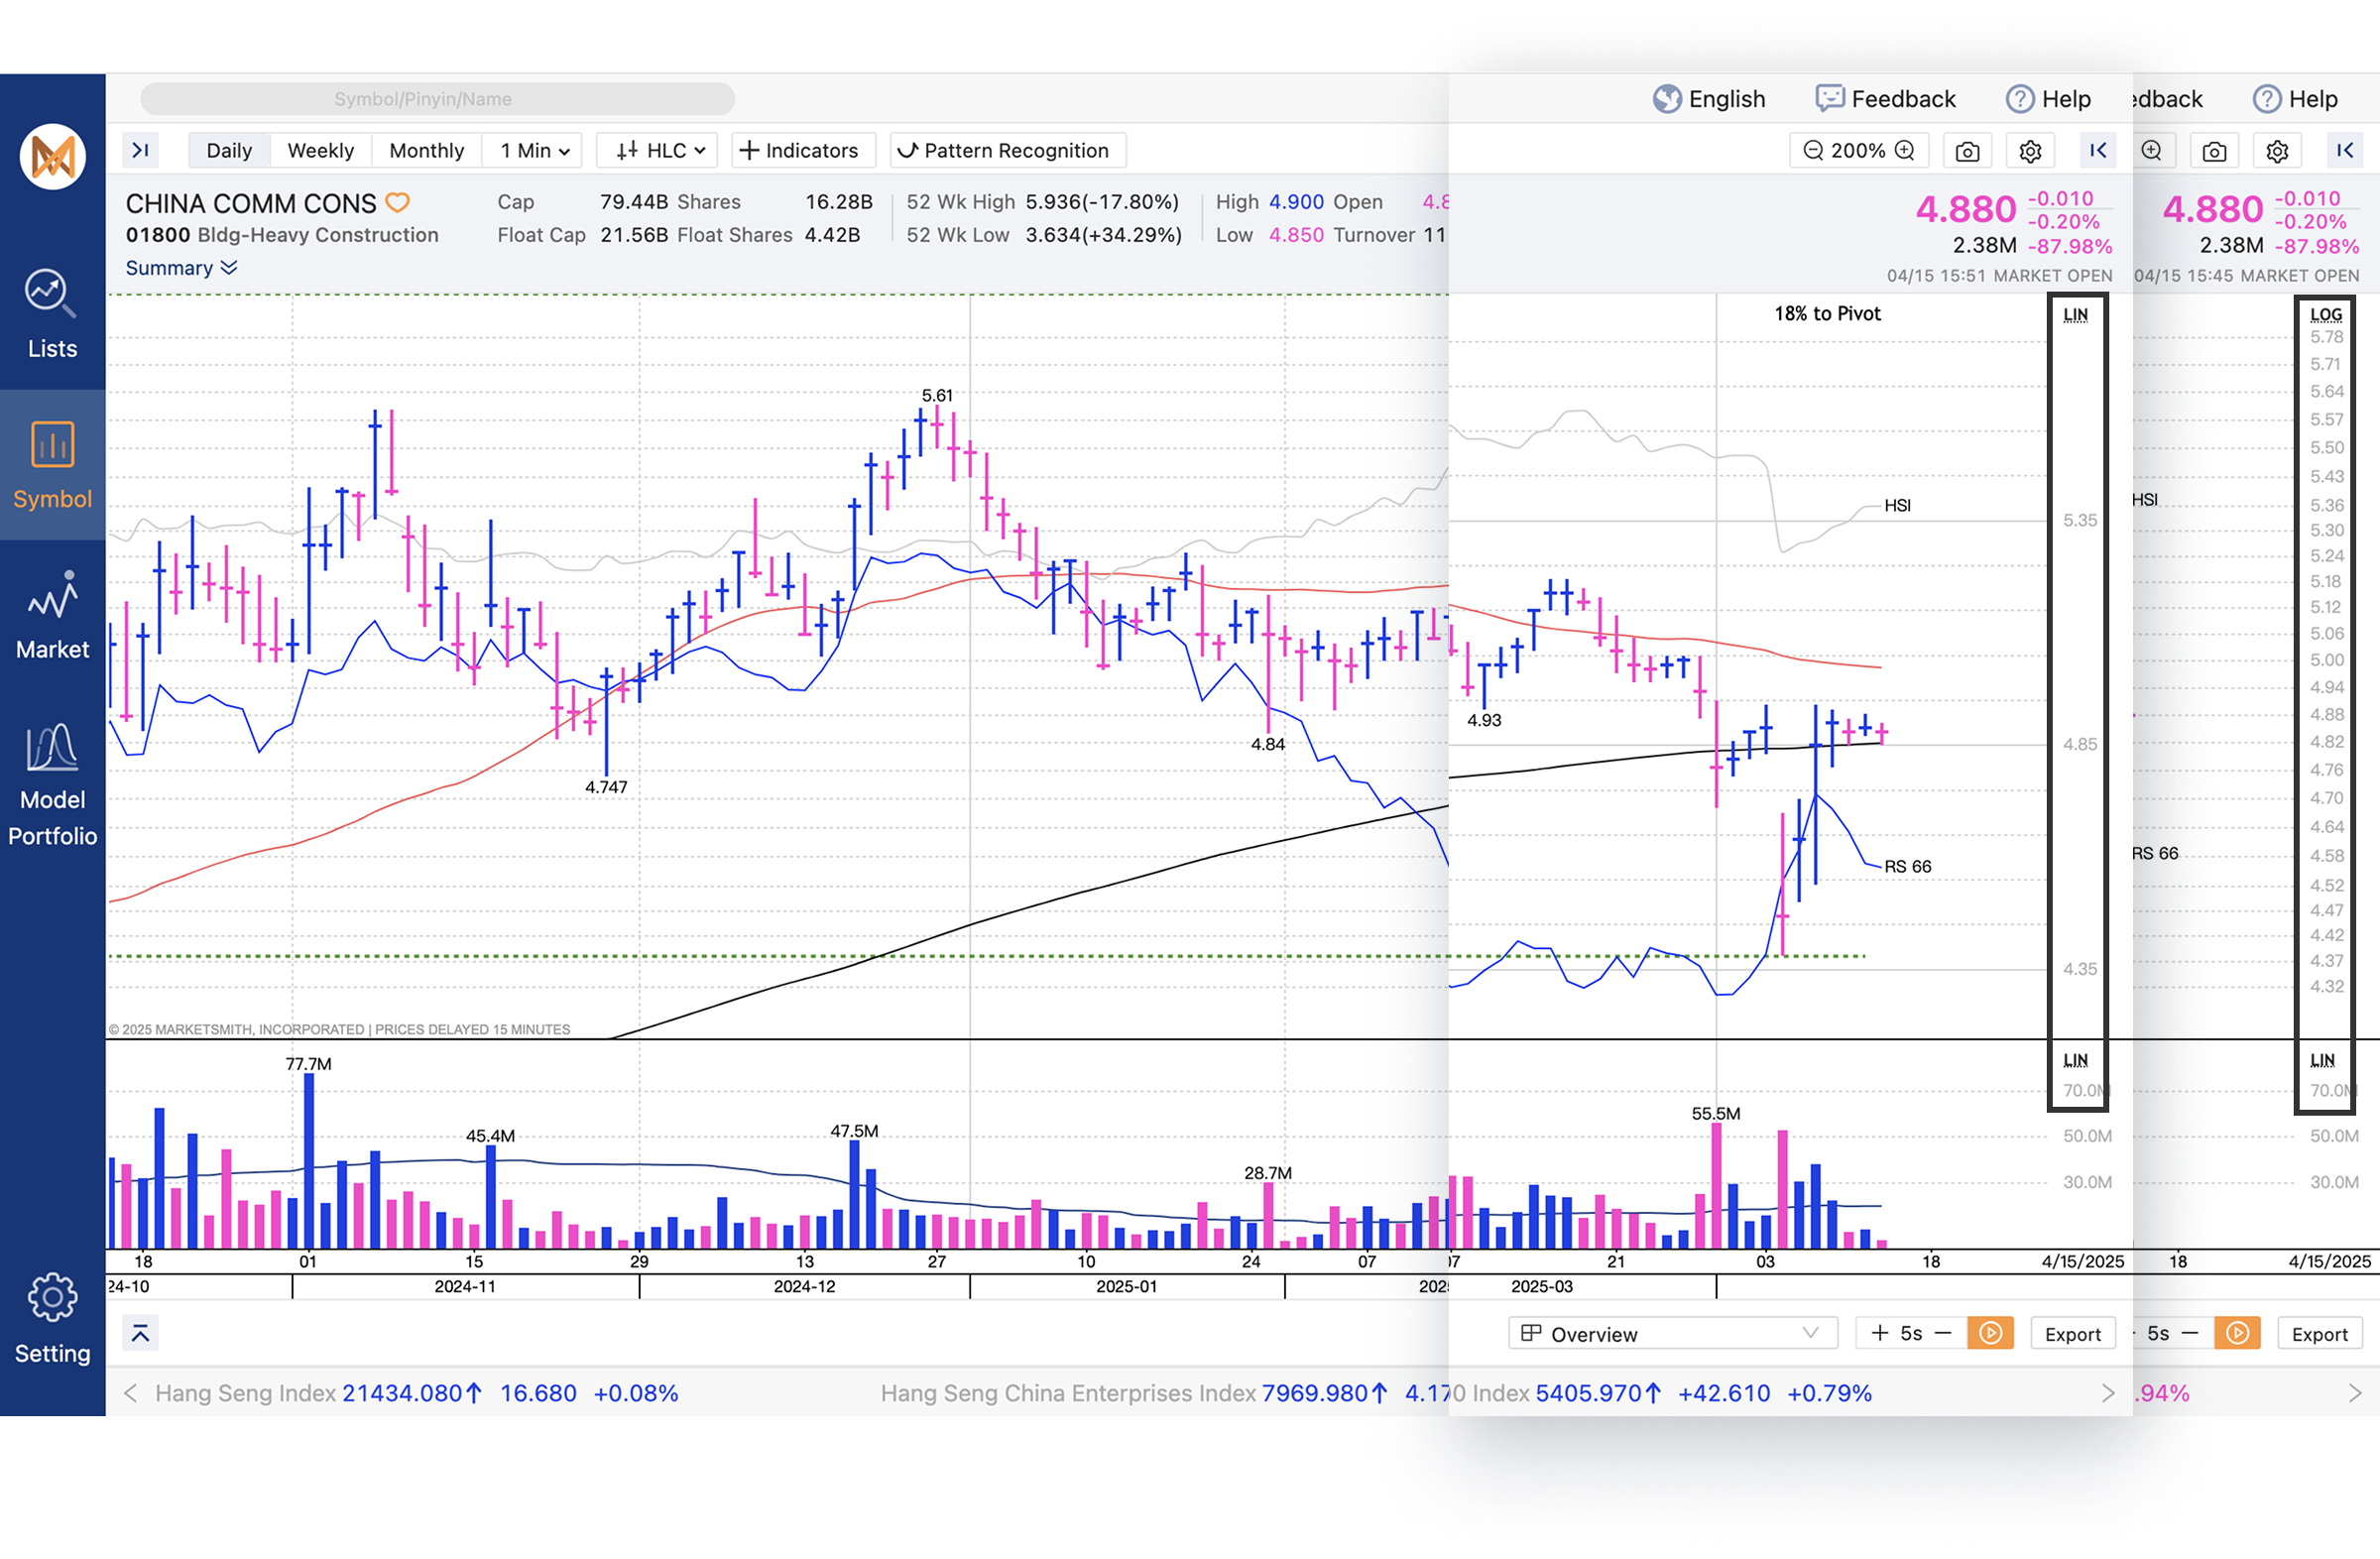
Chart Scaling
Our default scale for a weekly chart is a logarithmic (log) scale. Logarithmic scale intervals are based on percentage or proportional changes. For example, the percentage change from 1 to 2 (100%) is same as the movement from 2 to 4 (100%), 4 to 8 (100%), etc. We use a fixed log scale to ensure that the same amount of physical distance is used for similar percentage moves. This lets you quickly determine different characters among various stocks, from a stock that doesn’t move very much to a more volatile one.
The default scale for the daily chart is linear (lin). Linear scales use equal spacing between each value. This means that a move from 1 to 2 looks that same as a move from 10 to 11. This can let you see moves in greater detail.
If you prefer an alternative view, you can toggle the scale between log and linear by tapping on the vertical scale area. The same can be done for the volume scale.
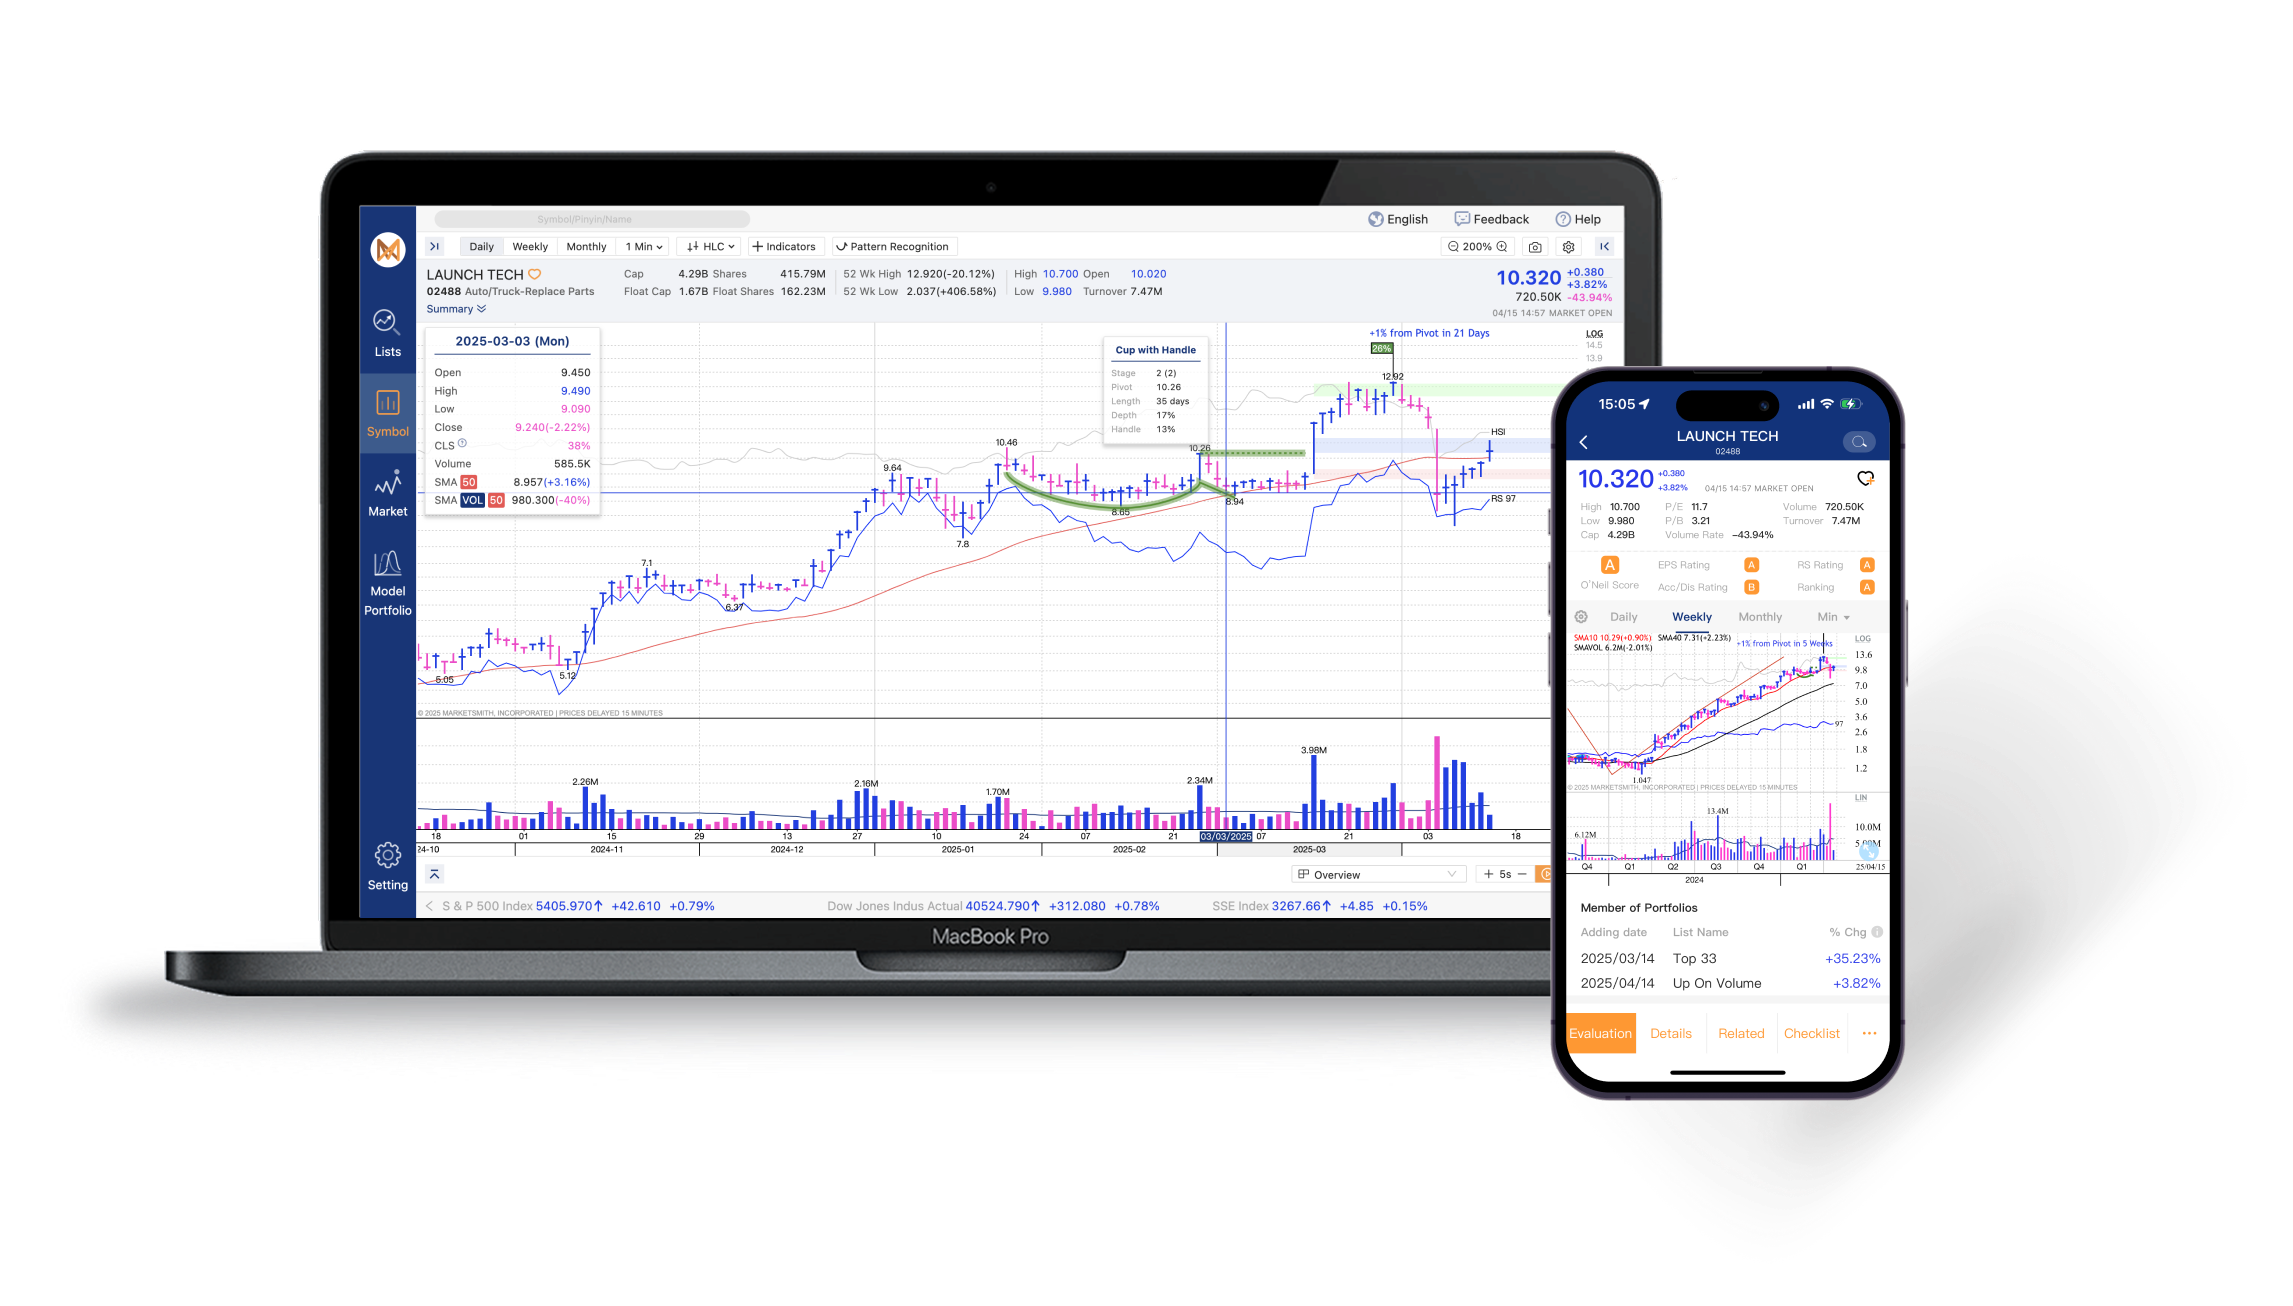
Pattern Recognition
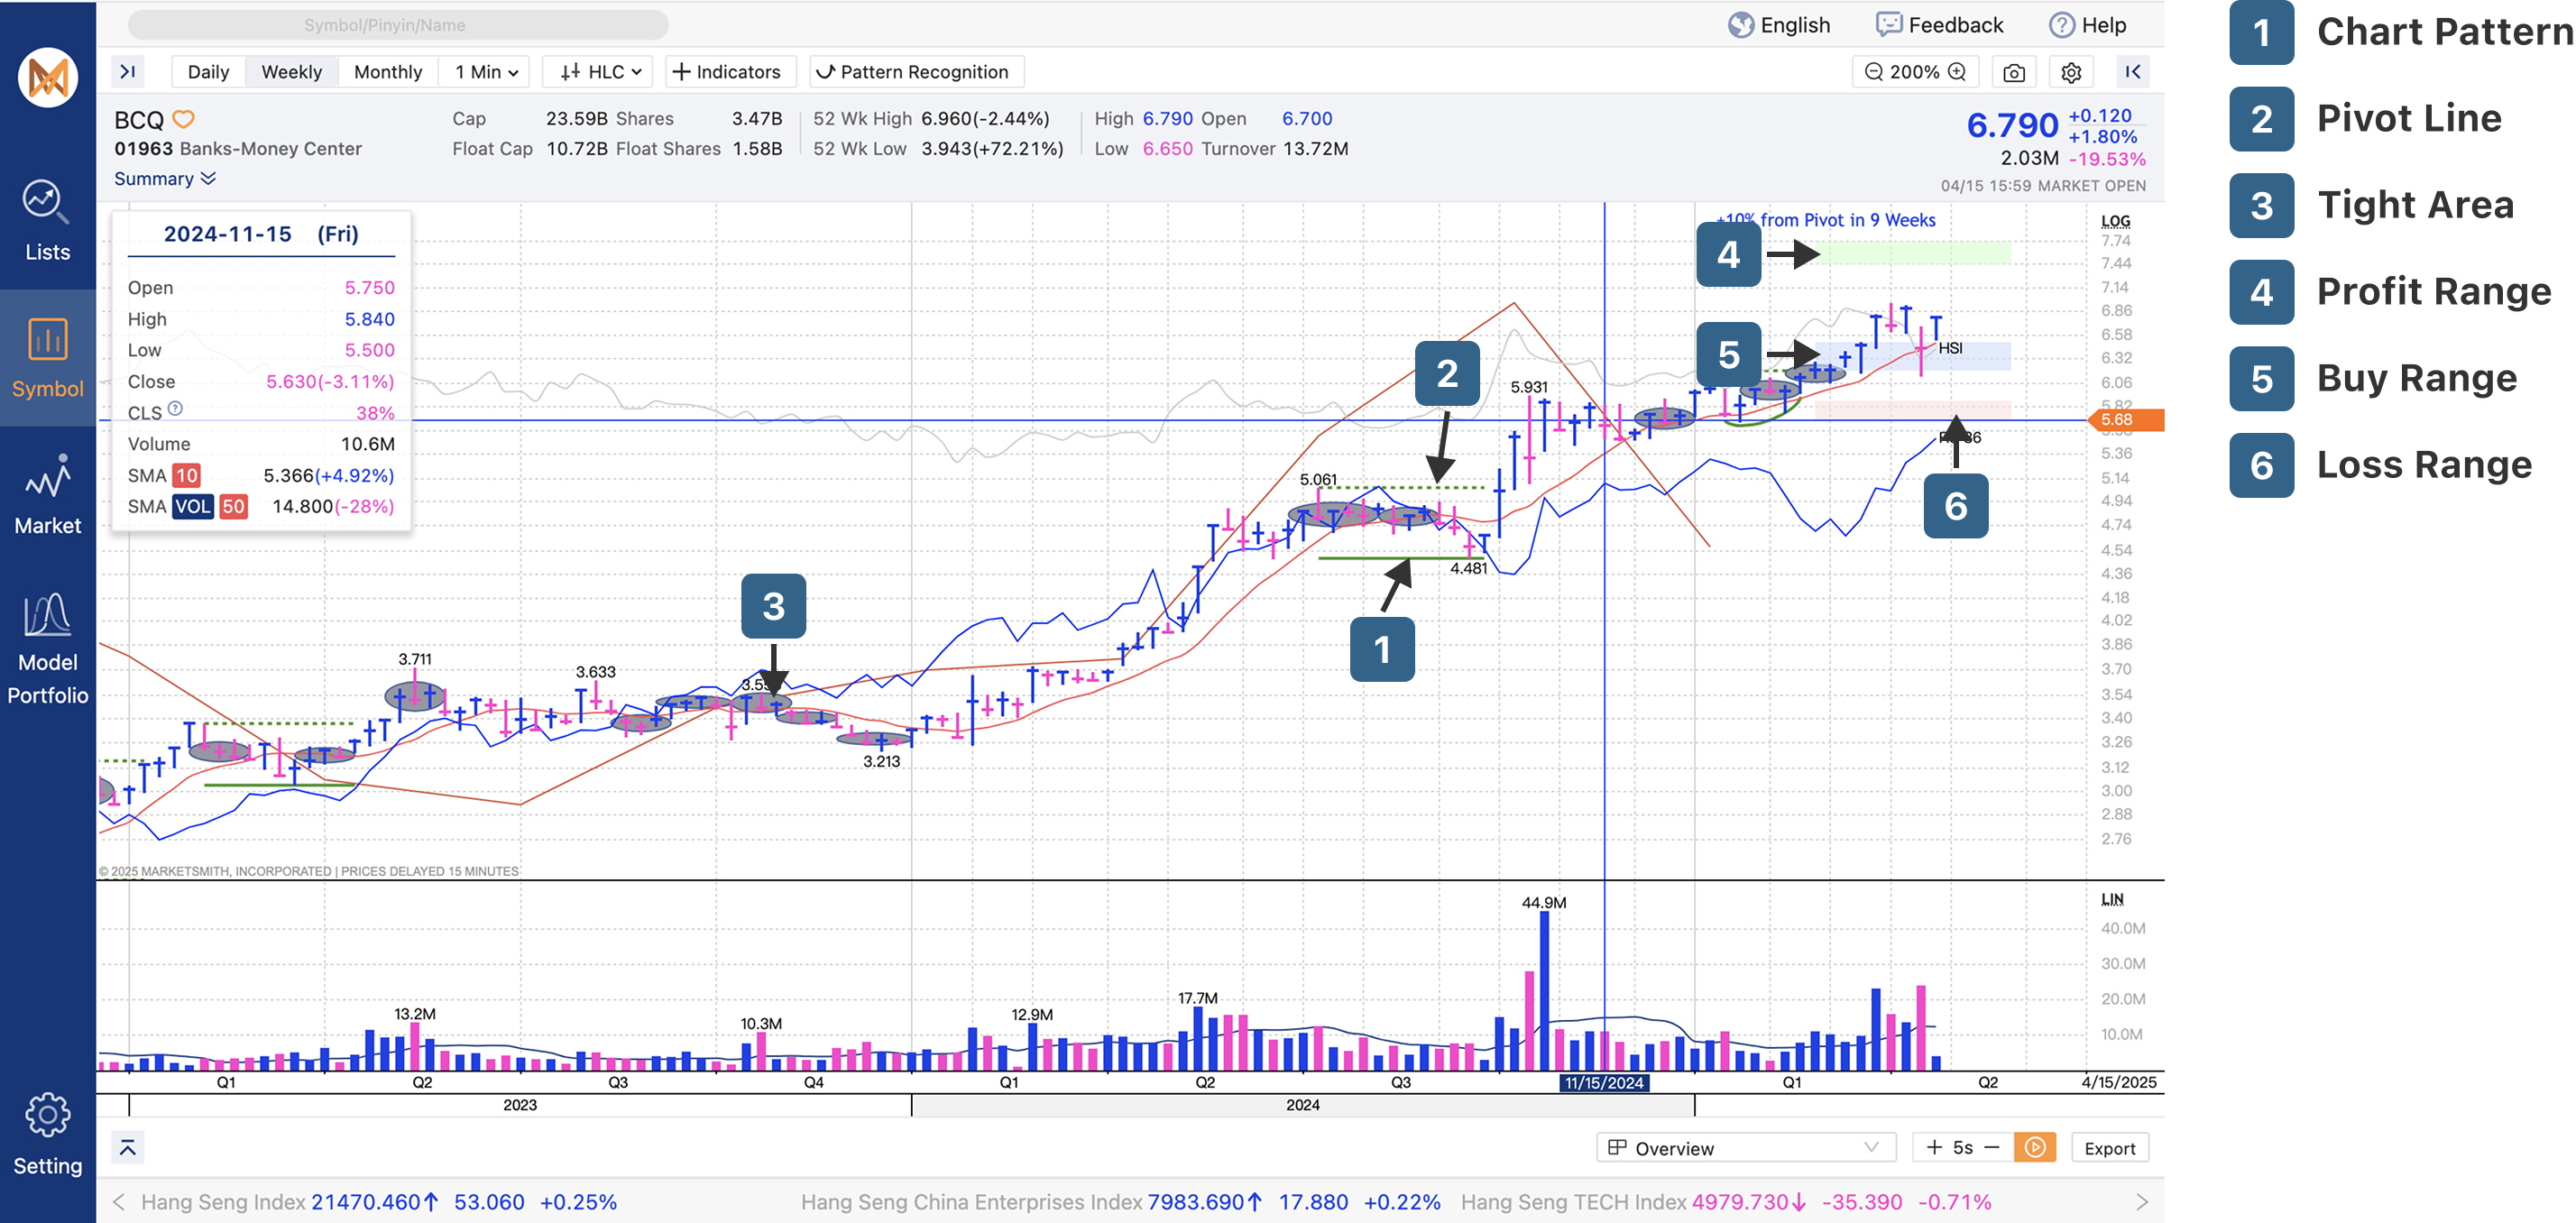
The founder of MarketSmith, William J. O’Neil, is one of the pioneers of technical stock analysis. In his studies of what works in the stock market he identified key patterns on stock charts that many of the biggest winners formed before they went on to huge gains. MarketSmith Hong Kong’s Pattern Recognition feature helps you spot these patterns.
The Pattern Recognition feature includes the following elements:
- Chart Pattern The solid dark green underscore identifies the pattern.
- Pivot Line The dashed dark green line represents the pivot line. When a stock passes the pivot line, it is a sign of technical strength. This is the ideal entry point to buy the stock.
- Tight Area Aqua blue highlights represent Tight Areas, which are identified when a stock closes within a 1.5% price range for at least three consecutive weeks. Tight Areas can be a sign of strength and serve as alternate entry points.
- Profit Range The box with the light green background, 20% to 25% above the pivot, is an area O’Neil recommends you consider locking-in initial gains.
- Buy Range The buy zone, 0% to 5% from the pivot price, is represented by a box with a light blue background.
- Loss Range The box with the pink background highlights 5% to 8% below the pivot price. To manage risk, O’Neil recommends that you limit losses to no more than 8%.
Earnings Block
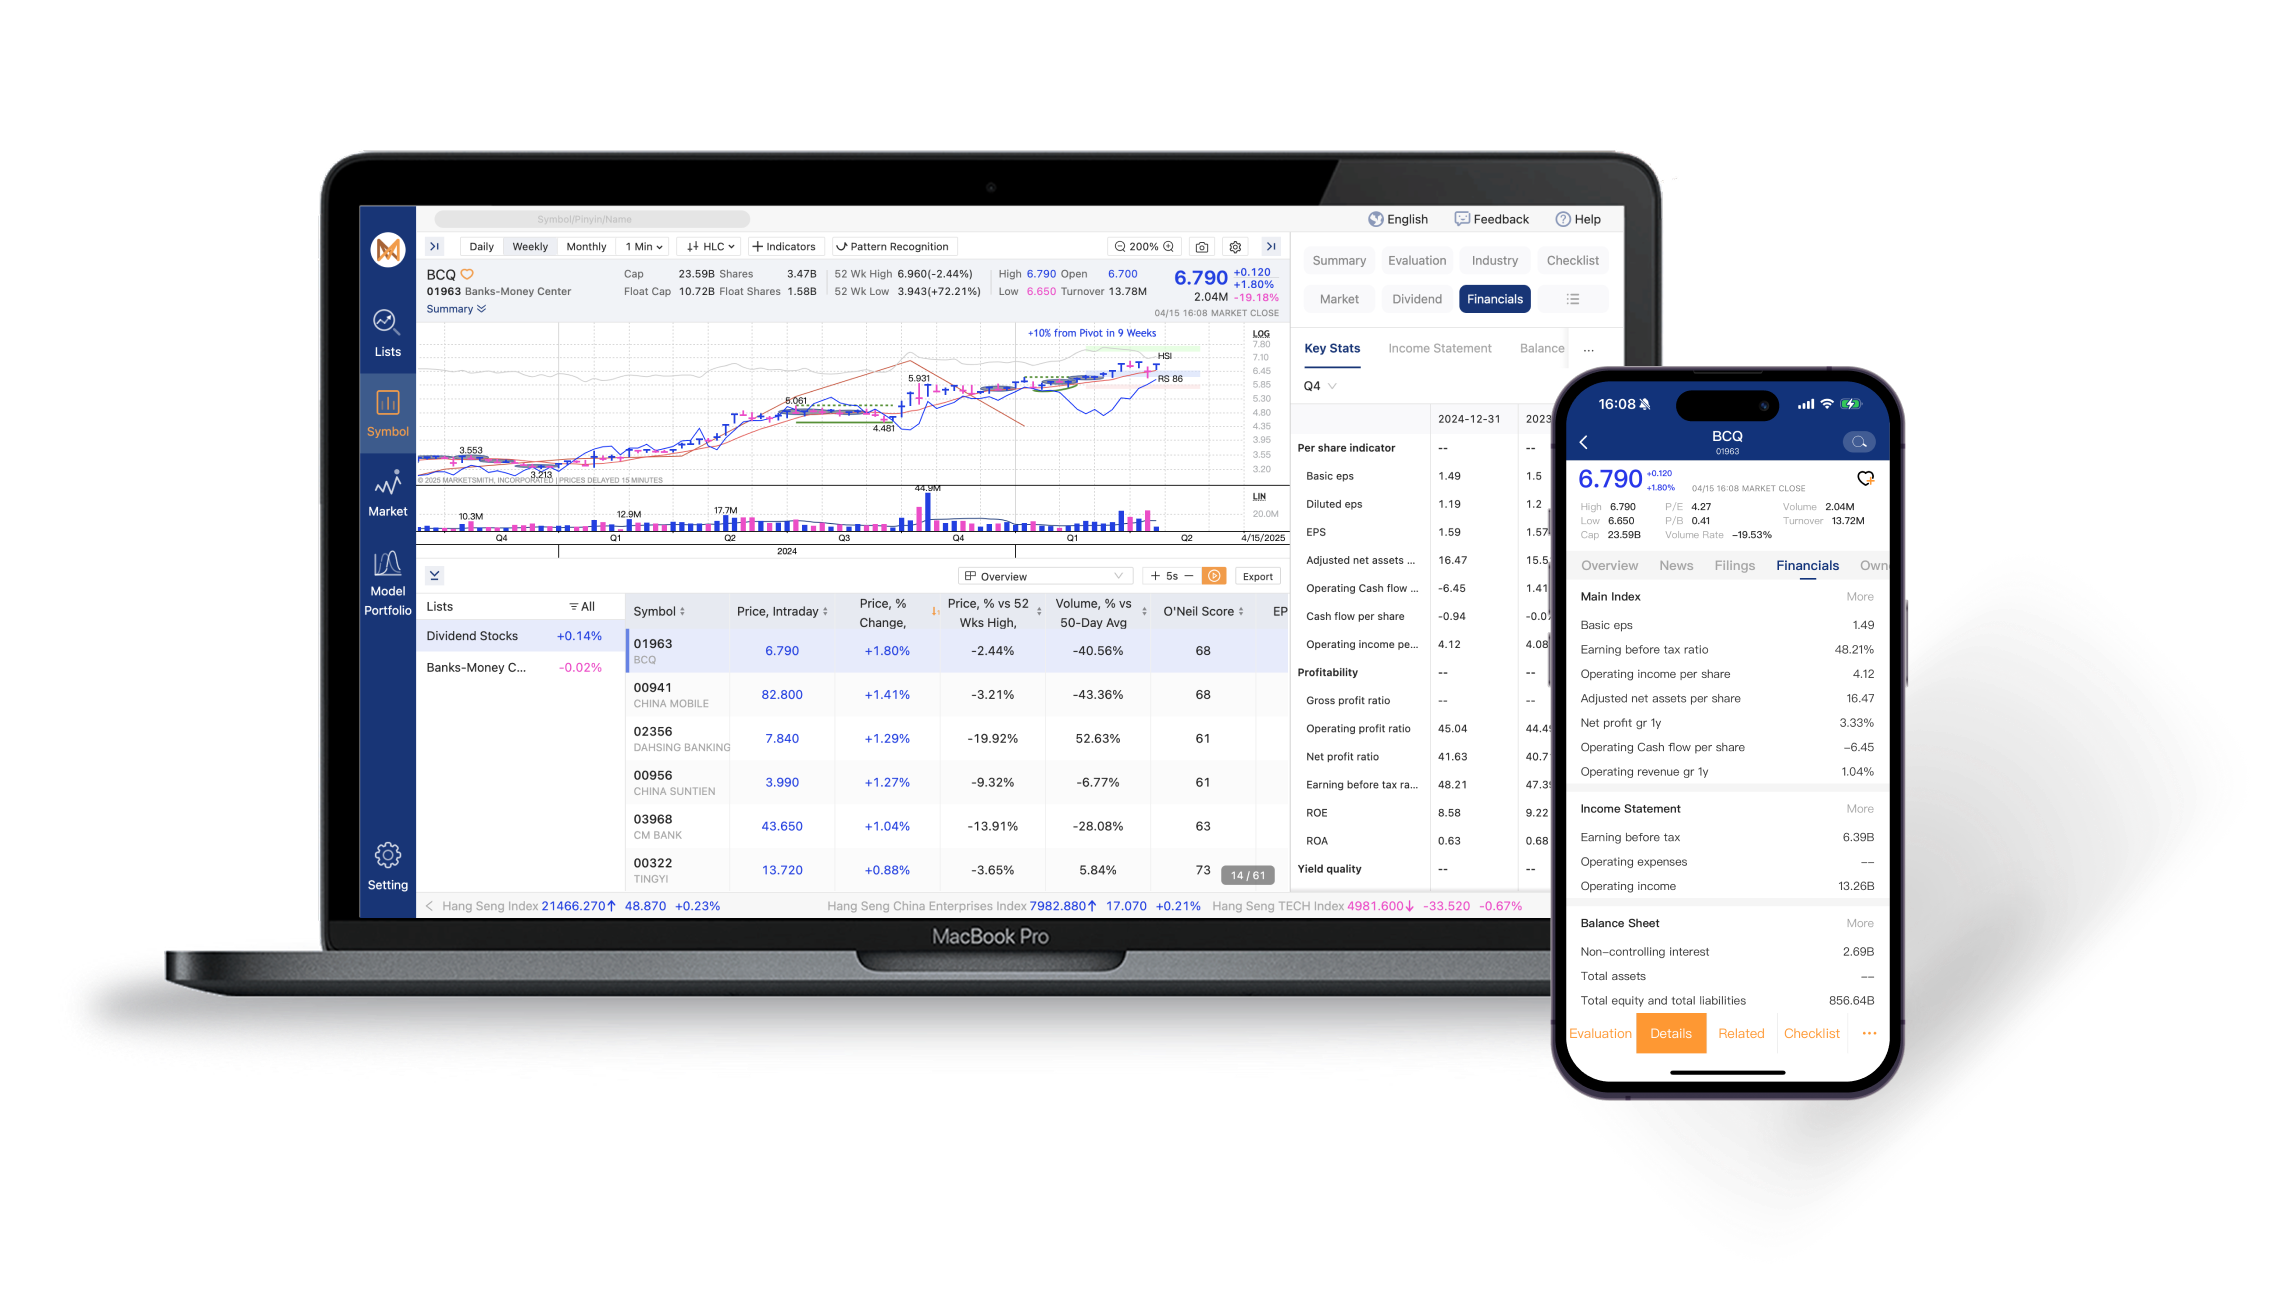
Integrated into the Desktop and Mobile views is our Earnings Block at the bottom of the chart. The view provides an efficient way to analyze both the technical and fundamental characteristics of a stock in one view. By tapping on the data, you can toggle the data in the block. The block is aligned so that the earnings information lines up to the quarter or semiannual period it represents.
The default toggle of the block contains percentage changes for earnings and sales on a year-over-year basis along with the margin after tax for the period. We like to focus on stocks with strong earnings and sales growth with strong and improving margins. The biggest winners often have earnings and sales growth of 25% or more. Pay particular attention to stocks with accelerating growth. Our studies have shown this is a potential sign of a great stock.
The alternative toggle of the earnings block provides the actual values on an earnings and sales basis along with the P/E Range for the period.