Observation Date: July 14, 2025
On July 14, 2025, Eoptolink (300502) closed at RMB 130.90. At that time, the stock was only about 5.54% below its 52-week high, already trading near a new-high area. Its fundamentals were also notable: net profit had increased 385% year over year over the past year, while revenue had increased 264%.
This article is not simply about “how much the stock rose later.” Instead, it goes back to the observation point of July 14, 2025 and reviews which signals were relatively clear under the CANSLIM framework, and which areas still required caution.
CANSLIM Seven-Dimension Review: In a Strong Phase, Which Signals Deserved More Attention?
C Current Earnings Quarterly growth was highly prominent
In Q1 2025, net profit increased 385% year over year, and revenue increased 264%. The company had maintained high-speed growth for two consecutive quarters, and the average net profit growth rate over the latest three quarters was close to 400%. One point to watch was that earnings acceleration had slowed to -20.65%, so the sustainability of future growth still needed ongoing tracking.
A Annual Earnings Growth had continued over the past several years
Over the previous five years, Eoptolink achieved positive growth in both net profit and revenue every year. Net profit posted a compound annual growth rate of 76.78%, while revenue posted a compound annual growth rate of 57.09%. Analyst consensus expected full-year 2025 net profit growth of 118.26%. This suggested that the market was not only looking at a single quarter, but also assessing whether the company could continue to maintain a high level of earnings growth over the coming period.
N New High Near the high, but confirmation of a valid breakout was still needed
The closing price on July 14, 2025 was RMB 130.90, only about 5.54% below the 52-week high. A stock trading near a new high usually indicates strong market attention and also suggests that the stock is not in a weak price area. However, being near a new high is not the same as having completed a valid breakout. What needed to be watched was whether the stock could continue to rise on stronger volume and whether there was enough buying support after a breakout.
S Supply and Demand Shareholder dispersion required attention
This was not the most comfortable signal. The number of shareholders increased from 64,900 in September 2024 to 118,100 in March 2025, an increase of 82%. A rising shareholder count usually means a higher degree of share dispersion. For a stock that had already risen significantly and was approaching a new high, this change needed to be included in risk observation. If the stock continued rising later, stronger capital support would be required.
L Leader or Laggard Relative strength was at a high level
Eoptolink had a market-wide relative strength score of 95 at that time, indicating that its price performance over the preceding period was stronger than most stocks. Although its industry ranking was 83, from a full-market perspective it was still clearly a relatively strong stock. In CANSLIM, the L dimension is not only about whether the stock is the absolute industry leader. More importantly, it asks whether the stock continues to outperform the broader market.
I Institutional Sponsorship Institutional holdings continued to increase
Institutional holdings increased from 190.36 million shares at the end of 2023 to 255.24 million shares at the end of 2024, a gain of more than 34%. An increase in institutional holdings suggested that medium- to long-term capital still had a certain level of confidence in the company. However, this should not be simplified into “if institutions bought it, it must be safe.” A more reasonable interpretation is that institutional participation provided one basis for observing whether the trend could continue.
M Market Direction The broader market environment was relatively supportive
At that time, the market index was above its 50-day moving average, the moving average was trending upward, and the index price was 4.21% above the MA50. For strong stocks, the market environment matters. If the broader market is in an uptrend, strong stocks are more likely to receive support from capital flows. Conversely, if the market turns down quickly, even strong individual stocks can be dragged lower.
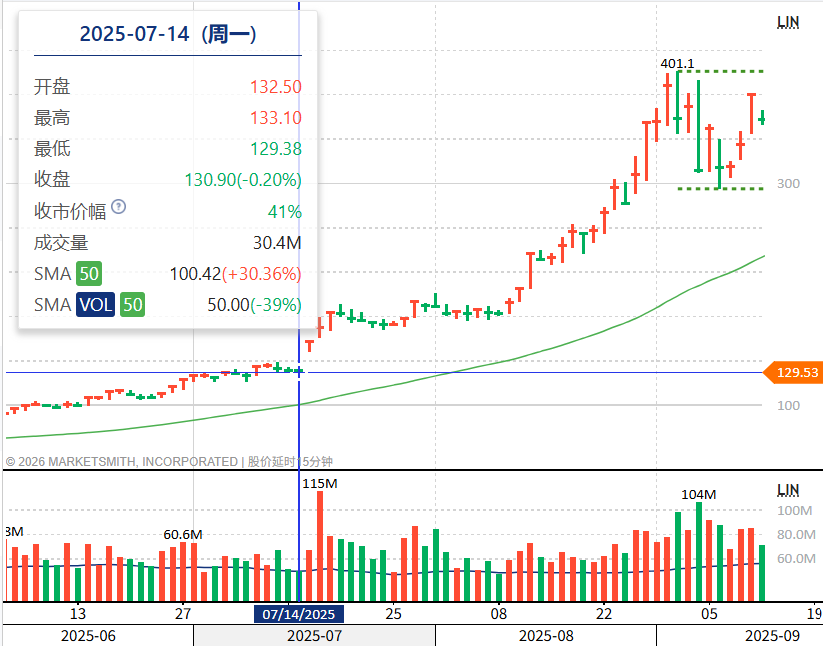
Historical Validation: What Happened After the Stock Approached a New High?
Looking at the following 90 trading days, Eoptolink performed very strongly during this period. Using the July 14, 2025 closing price of RMB 130.90 as the baseline:

On the next trading day after the observation point (July 15), the lowest price was RMB 148.28, which meant the drawdown based on the July 14 closing price was 0. By Day 58, Eoptolink closed at RMB 346.20, representing a gain of 164.48% during the period. This indicates that, from the July 14 observation point, multiple dimensions including C, A, N, L, I and M were indeed strongly aligned.
CANSLIM Observation: What Did This Case Validate?
At that time, Eoptolink was already close to its 52-week high, while its fundamentals, relative strength and market environment were all still relatively strong. For this type of stock, the key question is not whether it is “cheap,” but whether several important signals can continue to work together.
Based on the subsequent price action, the July 14 case of Eoptolink validated the value of the following observation points:
• Whether high earnings growth was still present
• Whether the stock price continued to approach or break into new highs
• Whether relative strength continued to hold up
• Whether institutional capital was still participating
• Whether the broader market environment remained supportive
Investment Highlights Summary
- Prominent quarterly earnings growth: Q1 2025 net profit +385% YoY; revenue +264%
- Good continuity in annual growth: net profit and revenue both remained positive for the past five years
- Stock price near a new high: the observation date was about 5.54% below the 52-week high
- High relative strength: market-wide RS score of 95
- Institutional holdings increased: institutional shareholdings rose by more than 34% from end-2023 to end-2024
- Shareholder dispersion required attention: shareholder count increased by 82% within about half a year
On July 14, 2025, Eoptolink showed fairly typical characteristics of a strong stock: high earnings growth, a price near a new high, strong relative strength, increasing institutional holdings, and a relatively supportive market environment. Subsequent performance clearly validated these signals. At the same time, this case also reminds us that even a strong stock does not have every dimension perfectly aligned. The shareholder dispersion issue under the S dimension was already something worth watching at that time.
Risk Reminder This article is only a historical case review based on the CANSLIM research framework and is intended for educational discussion. It does not constitute investment advice. Markets involve risk; investors should exercise caution. Historical performance is not indicative of future returns.
Published on May 18, 2026