Introduction
In stock investing, finding strong stocks in the market is key to achieving excellent returns. The Relative Strength Line (RS Line) and Relative Strength Rating (RS Rating) are two essential tools for evaluating stock performance, helping investors quickly identify high-quality stocks that outperform the market.
This article will delve into the concepts and applications of the Relative Strength Line and Relative Strength Rating, helping you identify truly strong stocks in the stock market.
Relative price performance is a good way to tell which of the five or six stocks you own is your true leader. If you’re going to do any selling, it’s normally correct to weed the flower patch by selling your worst-performing stocks first.
William J. O’Neil
What is the Relative Strength Line?
The Relative Strength Line is an important indicator that measures a stock’s performance relative to a benchmark index. By comparing the stock’s performance with the benchmark index, it visually reflects the stock’s performance relative to the market:
- When a stock outperforms the benchmark index, the Relative Strength Line rises;
- When a stock lags behind the benchmark index, the Relative Strength Line falls.
It is important to note that the Relative Strength Line is different from the Relative Strength Index (RSI). RSI is a technical indicator that measures price momentum, while the Relative Strength Line focuses on a stock’s performance relative to the overall market.
In MarketSmith Hong Kong, the Relative Strength Line is displayed in blue, located below the price line, with the latest Relative Strength Rating annotated.
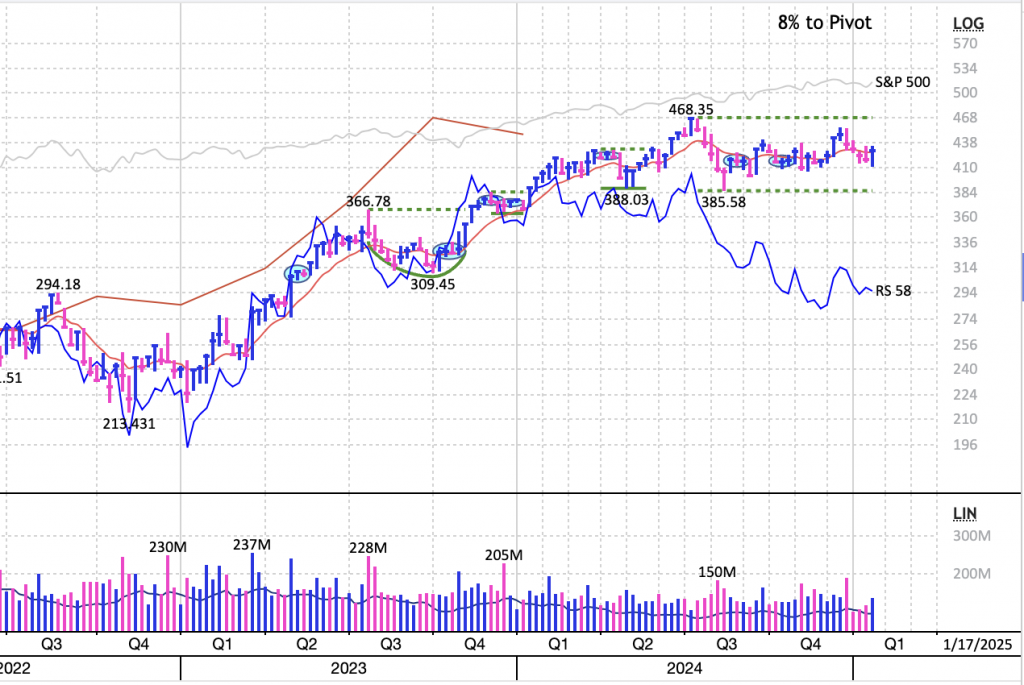
Benchmark indices: Typically, the CSI 300 Index is used to measure the performance of the A-share market, the Hang Seng Index for Hong Kong stocks, and the S&P 500 Index for US stocks.
How to Interpret the Relative Strength Line
When the Relative Strength Line rises, it means that the stock is outperforming the benchmark index. This trend can still exist even when the stock price falls. If the Relative Strength Line continues rising, it indicates that the stock’s price performance remains superior compared to the overall market and should still be watched.
Since the Relative Strength Line directly compares an individual stock with the overall market, it is especially useful for identifying market leaders. However, for stocks with prices near new highs, if the Relative Strength Line starts to decline, it indicates that the stock’s performance is weakening compared to the market, and investors should be cautious of being misled by the apparent high price.
When the Relative Strength Line breaks through previous resistance or pivot and reaches a new high, it typically signals that the stock is accelerating ahead of the market, which is a significant bullish signal. Stocks whose Relative Strength Line has already reached new highs before the breakout are even more promising in terms of investment potential.
During market downturns, the Relative Strength Line can help investors identify potential market leaders in advance. These stocks are often the ones that lead the next market rally and become the key investment opportunities.
What is the Relative Strength Rating?
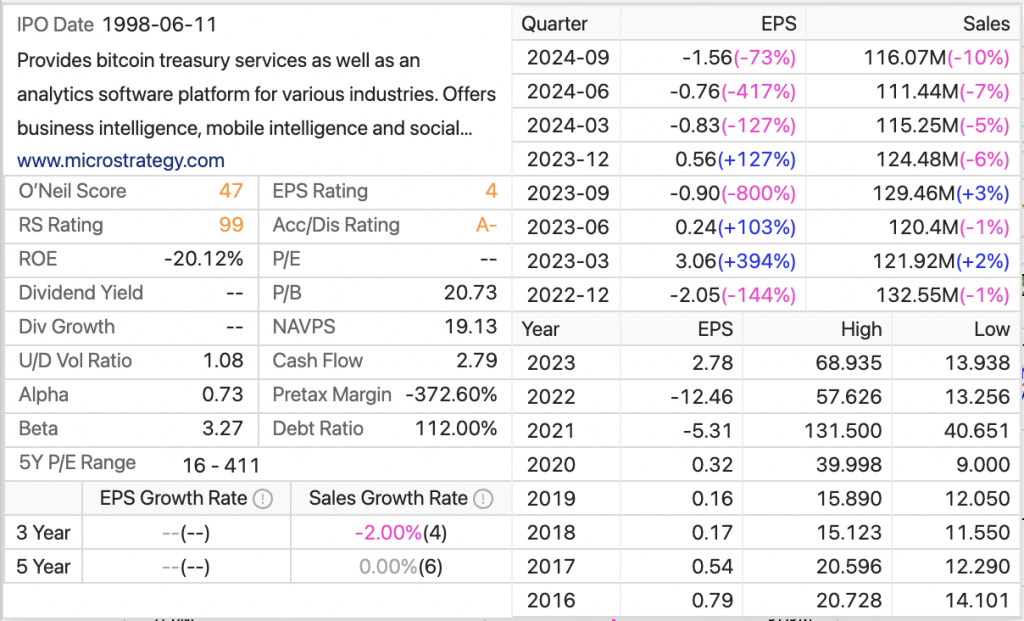
The Relative Strength Rating measures a stock’s price performance over the past 12 months using a percentile ranking, with values ranging from 1 to 99. A higher rating indicates better performance. For example, a stock with a Relative Strength Rating of 96 means its price performance is better than 96% of the stocks in the market, ranking in the top 4%.
A stock that experiences a strong rise often sees its Relative Strength Rating gradually increase from a lower level to a higher one, maintaining that high level for an extended period. When adding stocks to your watchlist or considering purchases, you should prioritize those with a Relative Strength Rating of at least 80. When deciding to sell, it is often wiser to sell stocks whose Relative Strength Rating has declined.
With the Relative Strength Rating provided by MarketSmith, you can quickly identify the best-performing stocks in the market and refine your investment strategies.
Relative Strength Rating vs. Relative Strength Line
Although both the Relative Strength Rating and the Relative Strength Line are used to measure a stock’s price performance, they focus on different aspects. The Relative Strength Rating is a quantitative indicator, comparing a stock’s price performance over the past 12 months with other stocks in the market, reflecting the stock’s relative position in the market. It uses a percentile ranking system, with a range from 1 to 99 to show the stock’s performance. A higher Relative Strength Rating indicates better price performance, placing the stock among the market’s top performers.
On the other hand, the Relative Strength Line is a dynamic graphical indicator that shows the stock’s performance relative to the benchmark index. By comparing the stock’s price movement with the market index’s movement, the RS Line visually indicates whether the stock has outperformed the market in different time periods. If the RS Line continues to rise, it suggests that the stock is performing better than the market, while a decline in the RS Line indicates the stock is underperforming compared to the market.
The relationship between the two is that the RS Line reflects the stock’s relative performance relative to the market over time, while the Relative Strength Rating provides a static relative ranking based on the stock’s past 12 months of performance. By using both the Relative Strength Rating and Relative Strength Line together, investors can more comprehensively analyze a stock’s current performance and future potential, providing strong support for investment decisions.
Conclusion
A deep understanding of the Relative Strength Line and Relative Strength Rating is key to screening for leading stocks. With the professional tools and data provided by MarketSmith Hong Kong, you can easily find the strongest stocks in the market and make more informed investment decisions.
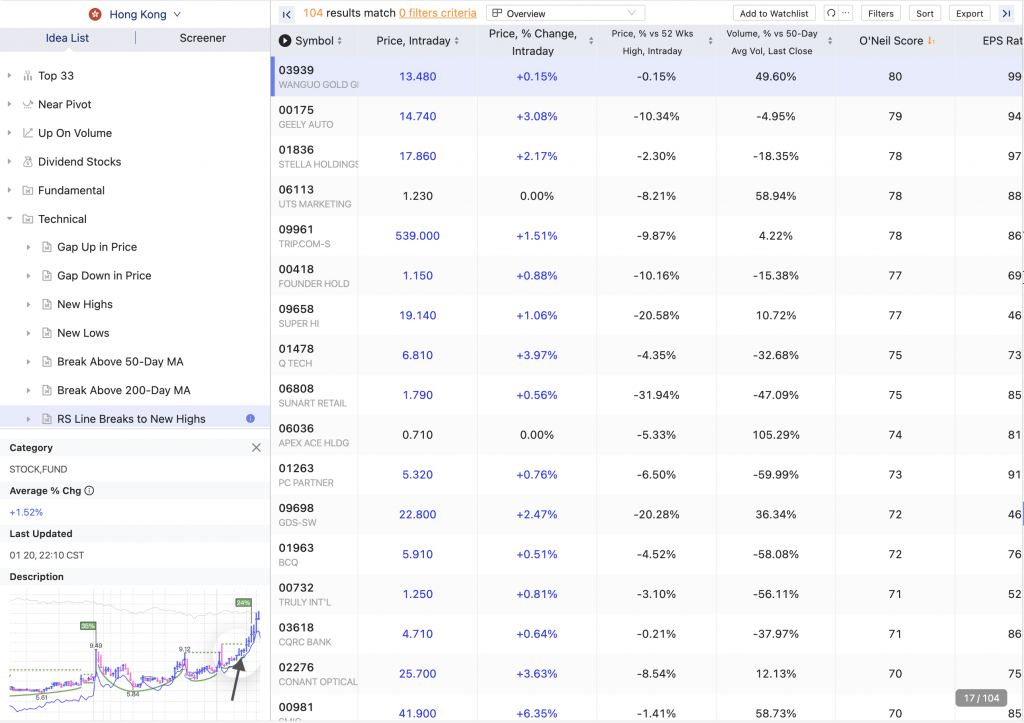
Want to discover stocks that have recently hit new highs on the Relative Strength Line and are near breakout points? Visit the “RS Line Breaks to New Highs” list updated daily on MarketSmith!
Published on Feb 07, 2025