The seven CANSLIM dimensions provide a structured way to validate candidates within popular growth themes. Start with M to assess the broader market and overall risk, then cross-check C/A earnings, N catalysts, S supply and demand, L relative leadership and I institutional ownership. This process helps filter out stocks supported mainly by narratives, while highlighting companies with a more complete growth case.
Why do retail investors struggle to hold growth stocks? A sector theme is not enough
Many investors approach technology growth stocks with a single idea: they see attractive long-term themes such as domestic semiconductor substitution or AI computing, then buy directly into the story without applying a full set of objective checks.
Experienced growth investors do not rely on an industry narrative alone. A narrative represents expectations, but it is difficult to quantify and offers no clear risk boundary. A complete CANSLIM framework addresses what to buy, when to buy, when to sell, how much loss to accept and when to take profits, replacing subjective forecasts with data and discipline.
Semiconductor Manufacturing International Corporation, or SMIC, provides a useful case study. The company sits at the center of China’s semiconductor localization theme. On 17 January 2025, the observation date used in this review, the stock closed at HKD 39.45, only 1.25% below its 52-week high. Yet an investor who held solely because of the localization story would still have faced a maximum drawdown of more than 36%. The sections below review the stock through the C/A/N/S/L/I/M dimensions and the related trading rules.
Observation Snapshot
Stock: SMIC (00981.HK)
Reference date: 17 January 2025; closing price: HKD 39.45
Market environment: The relevant index was below its 50-day moving average and in a weak corrective phase
Sector narrative: Expansion in mature-node capacity, continued policy support for domestic semiconductors, and faster localization of equipment and materials
M – Market Direction: Assess the market before the stock
Core principle: Even an excellent growth stock rarely remains independent of the broader market trend for long.
The overall market trend is the first filter in the framework. Most stocks are influenced by index movements. In a weak market, even a compelling industry story may not offset broad-based selling pressure.
On the observation date, the Hong Kong market was in a downward corrective phase, so the M signal was weak. Although several of SMIC’s other indicators were constructive, the stock still carried elevated volatility risk. The subsequent price action reflected that risk: the stock fell 8.75% shortly after the reference point and recorded a maximum drawdown of 36.85% during the review period.
Investors who focus only on the long-term localization thesis and ignore a weakening M signal can become trapped in a systemic correction. Assessing market direction first is therefore the first line of defence against large portfolio drawdowns.
Sector Positioning: A strong theme defines the hunting ground, not the buy decision
Domestic semiconductors are a structurally attractive sector and can produce a number of strong stocks. However, sector popularity is not the same as a buy signal.
A common mistake is to assume that a large addressable market guarantees that every stock in the sector will rise. Sector strength is only a background condition. It must be confirmed by C/A earnings, N catalysts, S volume behavior, L relative strength and I institutional ownership. SMIC operated in a favorable sector but ranked well below the top names within its group. That distinction matters: a sector theme can narrow the universe, but it cannot independently justify an entry.
C – Current Earnings and A – Annual Earnings: The hard evidence behind the story
Industry narratives ultimately need to show up in revenue and profit. Consistent earnings growth is a key threshold for identifying genuine growth companies.
C – Current Quarterly Earnings
In the third quarter of 2024, earnings per share increased 58.32% year on year, revenue rose 33.98%, and adjusted net profit increased 42.78%. Revenue had grown steadily for four consecutive quarters. The improvement was attributed to capacity expansion and a better product mix rather than one-off subsidies or asset disposals.
By contrast, many semiconductor concept stocks have a localization narrative but declining quarterly revenue and profit. These are classic examples of ‘story without earnings’, with limited fundamental support for a sustained advance.
A – Annual Earnings
SMIC’s five-year revenue compound annual growth rate was 20.03%. Operating cash flow per share remained positive, while the debt-to-asset ratio stood at 33.44%, a relatively healthy level for a capital-intensive expansion model.
Stable long-term cash flow and compound growth indicate an ability to generate internal funding. This helps distinguish the company from smaller stocks that rely repeatedly on financing and experience only short-lived thematic rallies.
N – New Factors: Industry catalysts plus price highs
N refers to new developments that can change a company’s growth expectations. These may include a new industry trend, a new business catalyst or a new price high. Such developments often support the start of a major advance.
In this case, SMIC showed two reinforcing N signals:
Industry catalysts: improving demand for mature-node products, faster adoption of domestic semiconductor equipment and continued localization support.
Price signal: the stock was only 1.25% below its 52-week high and had made several interim highs within the prior 60 days.
If a stock has an attractive localization story but remains stuck at low levels without making new highs, it may indicate that the market has not yet accepted the expected improvement in the business outlook.
S – Supply and Demand: Use price and volume to read real capital flows
Price shows direction, while volume reveals the market’s level of commitment. Positive sector news alone does not guarantee sustained buying.
Over the 50 trading days before the observation date, average volume during advancing periods was 2.05 times the average volume during declining periods. Volume expanded on advances while selling pressure during pullbacks was comparatively limited, indicating favourable supply-demand conditions.
The S data therefore suggested that interest in the domestic foundry leader was not driven solely by short-term retail enthusiasm; there was evidence of continued active positioning. Purely thematic stocks often display the opposite pattern – weak volume on advances and heavy volume on declines – which points to poor sponsorship and limited durability.
L – Leader or Laggard: A good sector still contains weak stocks
Leadership tends to persist in strong markets, and relative strength is a practical way to distinguish sector leaders from laggards.
A key risk in this case was SMIC’s relative strength score of only 62 out of 99 at the observation point. It ranked 121st within the semiconductor group, placing it around the middle of the sector rather than among the leading stocks.
This exposes the central weakness of a sector-only thesis. Investors may assume that all companies in a favourable industry will rise together, but the L dimension highlights differences in stock-level performance. Even within the same localization theme, other companies may offer stronger fundamentals or better price momentum. Selecting only by sector can leave an investor holding a laggard that underperforms its group.
I – Institutional Sponsorship: Professional ownership helps validate the case
Large, sustained advances are usually supported by institutional capital. Stocks without meaningful institutional participation are more likely to be driven by temporary retail sentiment.
At the observation point, funds collectively held about 9% of the company, well above the 3% median for the broader market. Continued institutional accumulation suggested that professional investors had conducted research and found support in both the localization thesis and the company’s reported results.
By comparison, retail-driven thematic stocks often have limited institutional ownership and little long-term sponsorship. When sector sentiment cools, they can decline sharply and quickly.
A 60-Trading-Day Review: Using discipline to manage growth-stock volatility
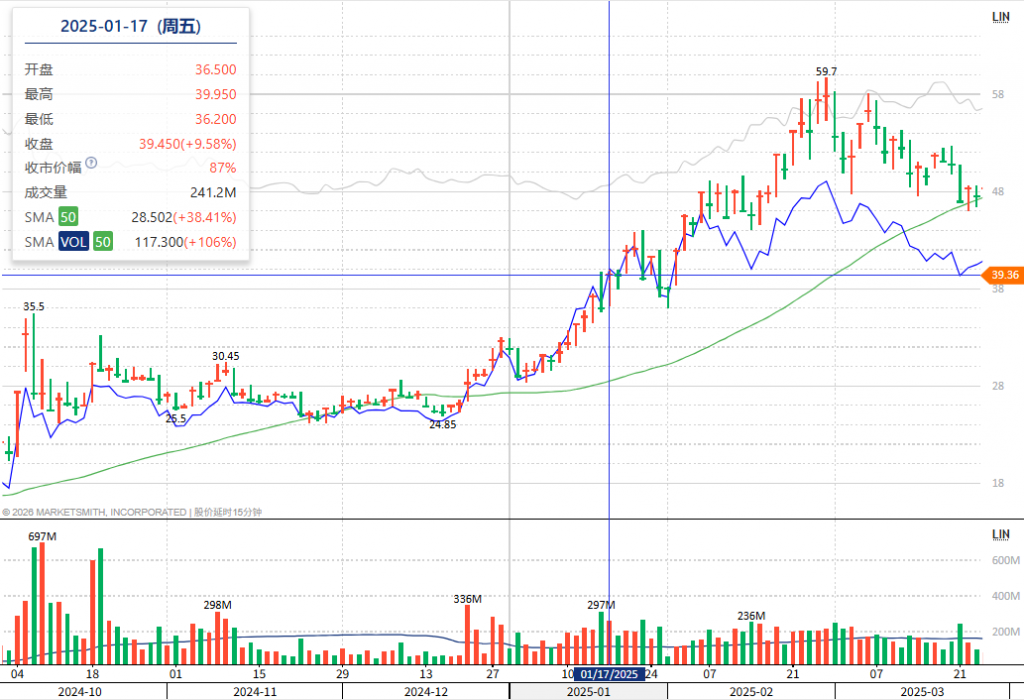
Using HKD 39.45 as the reference price, the subsequent range illustrates the practical role of three rules: an 8% stop-loss, a 25% swing profit objective and the eight-week holding rule.
8% Stop-Loss: Limit the loss before it becomes a major drawdown
On the 11th trading day after the reference point, the stock fell to HKD 36, a decline of 8.75%, just beyond the stop-loss threshold.
An investor who refused to sell because of the localization story would later have faced a maximum drawdown of 36.85%. A disciplined stop-loss can cap an individual loss at a manageable level and preserve capital for the next opportunity.
25% Swing Profit-Taking: Realise gains instead of assuming every move will double
Within the CANSLIM trading framework, many growth stocks produce a typical advance of roughly 20% to 25% after a breakout, making staged profit-taking a practical way to protect gains.
SMIC later rose rapidly, reaching a maximum gain of 51.33% during the reviewed range. For a stock with only middling relative strength, taking partial profits near a 25% gain could reduce the risk of giving back a large portion of the advance. Holding solely because of the sector story can result in riding the entire round trip.
Eight-Week Holding Rule: Separate normal shakeouts from a genuine trend reversal
The rule states that when a stock rises 20% or more within three weeks of a breakout, it may be appropriate to hold for at least eight weeks, helping investors avoid selling too early during normal volatility.
In this case, the main advance occurred within 41 days of the reference point, still inside the eight-week observation window. Although the stock experienced sharp swings, the broader advance had not yet been fully invalidated.
Investors who react only to short-term price changes can sell in fear during a pullback and miss the subsequent advance. The eight-week rule offers an objective observation standard; it is not a reason to hold indefinitely on faith in the sector.
After the full 60-trading-day period, the stock closed at HKD 46, representing a cumulative gain of 16.60%, while the total range reached 60.08%. The positive outcome reflected the interaction of the C/A/N/S/L/I/M signals and trading discipline, rather than the sector narrative alone.
Key Takeaways for Hong Kong Technology Growth Stocks
- Use the industry narrative to define the opportunity set, not as the sole reason to buy or hold.
- Themes such as domestic semiconductors or AI computing should be translated into measurable revenue and earnings growth.
- Complete the full CANSLIM review: M for the market, C/A for earnings, N for new catalysts, S for demand, L for leadership and I for institutional support.
- Reduce exposure in a weak market rather than making a large counter-trend bet on a single sector story.
- Technology growth stocks are naturally volatile; stop-losses, staged profit-taking and holding rules help prevent emotional decisions.
Important Notice
This article reviews the historical price action of SMIC (00981.HK) solely to illustrate a growth-stock trading framework. It does not constitute investment advice or a recommendation regarding any Hong Kong-listed security. The semiconductor industry is affected by geopolitical policy, equipment supply, industry cycles and macro liquidity, and share prices can be highly volatile. Historical performance does not indicate future results. Investors should make independent decisions based on their own objectives and risk tolerance.
Published on Jul 14, 2026